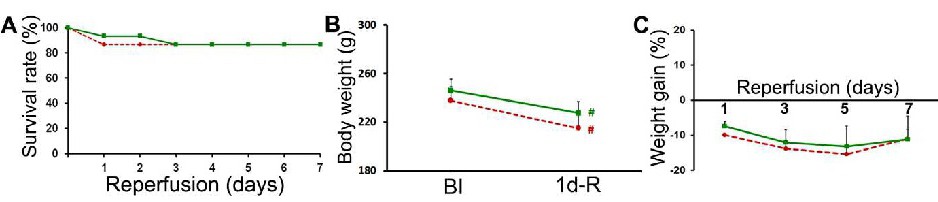
Fig. 3. Post-stroke mortality and body weight changes. Line graphs represent the percent survival rate (A), the reduction in body weight (B), or percent body weight gain (C) of rats. Dotted, and solid lines represent the data of ischemia-induced animals that were treated with vehicle, and exosomes respectively. BI-before ischemia; R-reperfusion. Error bars indicate SEM. n=15 for mortality assessment and n=7-9 for body weight assessments. #p<0.05 vs. BI.